Day 2 — Rent a GPU, Serve an Endpoint: The plumbing has its own roofline
Unit 1.2 from Curriculum. Follows Day 1 — Local Inference. Lab notes and polished narrative interwoven.
The question: what does it actually take — in minutes and dollars — to go from nothing to my own OpenAI-compatible endpoint on a rented GPU? And does Day 1’s formula (bandwidth ÷ model bytes) still predict decode speed when the hardware is 8x faster? The answer: it did, roughly. What it didn’t predict was everything around the number: a cold start is its own set of rooflines, and most of them aren’t physics, they’re software.
Day 1 was the physics; Day 2 is the plumbing. The plumbing is where the time goes, so today the cold start itself is a measurement, not an obstacle.
Setup
- A100 80GB PCIe, Prime Intellect, $1.20/hr on-demand. (4090 was the original plan — unavailable that day; scarcity meant “grab whatever’s on-demand with good availability” instead. For reference, memory bandwidth of common rentals: RTX 4090 1,008 GB/s, L40S 864, A100 80GB ~2,000, H100 SXM 3,350.) This card: 1,935 GB/s memory bandwidth, 312 TFLOPS bf16 dense tensor-core throughput.
- Qwen3-8B, bf16 safetensors (not the Q4 GGUF from Day 1) — vLLM’s default, HF-native sharded weights; ~16 GB of weights means it needs a 24 GB card minimum. Exact size read straight from the safetensors header metadata (
total_size): 16,381,470,720 bytes = 16.38 GB — no ambiguity about what counts as a “parameter” the way GGUF’s block-quantization overhead created on Day 1. - vLLM, OpenAI-compatible server. Same reason as always for choosing it over llama.cpp here: serving-first design (continuous batching, PagedAttention, native OpenAI routes), CUDA-first.
The math (predictions in ink, before running)
Decode (bandwidth roofline) — same formula, new silicon:
decode ceiling = bandwidth ÷ weight bytes = 1,935 GB/s ÷ 16.38 GB = 118.12 tok/s
Prefill (compute roofline):
prefill ceiling = compute ÷ FLOPs-per-token = 312×10¹² ÷ (2 × 8.19×10⁹) = 19,047.6 tok/s
The ratio matters more than either number alone: A100 prefill/decode ≈ 161×, versus the M4’s ≈ 11× (Day 1: 228.9/20.8). The A100 has vastly more compute relative to its own memory bandwidth than the Mac does — its “balance point” (FLOPs it can do per byte moved) is much further out. Batch-1 decode can’t touch that compute at all; it’s purely bandwidth-bound. So the more lopsided a chip’s compute-to-bandwidth ratio, the more of its capability sits idle at batch 1. Datacenter GPUs are built assuming you batch; running them one request at a time is close to adversarial to the hardware.
The rest of the ink, guessed per-stage before touching the box:
- Decode efficiency: 80% of ceiling (reasoning: bigger/non-unified memory subsystem costs some, CUDA-graph capture claws some back)
pip install vllm: 50s · HF weight download: 640s (from a single-stream speedtest, 25.6 MB/s) · engine init: 20s · TTFT from the laptop: 140ms- Predicted slowest stage: weight download — actually the fastest clean stage; pip install was the real slowest
- Total spend: not fixed in advance; actual was ~$1.20/hr × well under 2 hrs of billed time
Steps
Time every stage — this table is today’s chart:
- T0 Rent the instance (note provisioning wait) — rented, but the clean timestamp got lost in an SSH-key detour
- T1 SSH in;
pip install vllm— 186.566s - T2
vllm serve Qwen/Qwen3-8B --max-model-len 16384— download 46.966s, engine init 51.299s (after routing around a missing-nvcccrash withVLLM_USE_FLASHINFER_SAMPLER=0) - T3 First token from the laptop — 95ms TTFT, via curl through an SSH tunnel (
ssh -L 8000:localhost:8000, since this instance was SSH-only, no exposed HTTP port) - Batch-1 decode rate: 75.0 tok/s from vLLM’s own periodic log line, one long completion (
max_tokens: 1000) — 63.5% of ceiling, confounded by the disabled fused sampler - Restart
vllm servewith weights already on the volume → warm start time vs cold — no separate persistent volume was configured on Prime Intellect this time; the timed rerun (51.3s) is a reasonable stand-in but isn’t a true separate-volume warm start. Deferred to Day 3: check what Prime Intellect actually offers for persistence before relying on it. - Save the template/image + volume; write down the exact resurrection steps for Day 3 — not done, same reason. Chased the fused-sampler/CUDA-toolkit fix instead of this; worth doing first thing next time so Day 3 doesn’t restart from zero.
Predictions vs measurements
| Stage / Quantity | Predicted | Measured | Notes |
|---|---|---|---|
| Provisioning | — | not cleanly captured | SSH-key mismatch (wrong key pasted, then key file location confusion) ate the clock before a clean T0→SSH timestamp was taken |
Env setup (pip install vllm) | 50s | 186.566s (real) | ❌ 73% under, missed 3.7×. Heavy CUDA/PyTorch dependency tree; user+sys (161.7s) < real (186.6s), ~25s was I/O wait, not CPU |
Weight download (hf download) | 640s | 46.966s (real) | ❌ 13.6× overestimate. HF’s Xet backend does parallel chunked fetch (365 MB/s → 1.18 GB/s reported) from a well-peered CDN; a single curl stream to an unrelated server (thinkbroadband, UK) was the wrong proxy entirely |
| Engine init (load → CUDA graphs → ready) | 20s | 51.299s (real) | ❌ 61% under, missed 2.6×. First attempt crashed (nvcc missing — FlashInfer’s fused sampler tried to JIT-compile and failed); fixed by VLLM_USE_FLASHINFER_SAMPLER=0, timed on the clean rerun |
| First token from laptop (TTFT, tunneled) | 140ms | 95ms | ❌ 47% overestimate; reasoning (“almost entirely network”) was right in kind — prefill (~20 tok) + one decode step are both sub-10ms next to the SSH-tunnel round trip |
| Total cold, nothing → token (excl. provisioning) | — | 284.9s ≈ 4.75 min | |
| Warm restart (weights + deps already present) | — | 51.3s | this is the engine-init number — no separate volume, but the second timed vllm serve run had weights on local disk and vllm installed, functionally the warm case |
| Decode efficiency | 80% of 118.12 | 63.5% (75.0 tok/s) | ❌ miss, and lower than Day 1’s 87% Mac number — confounded, see below |
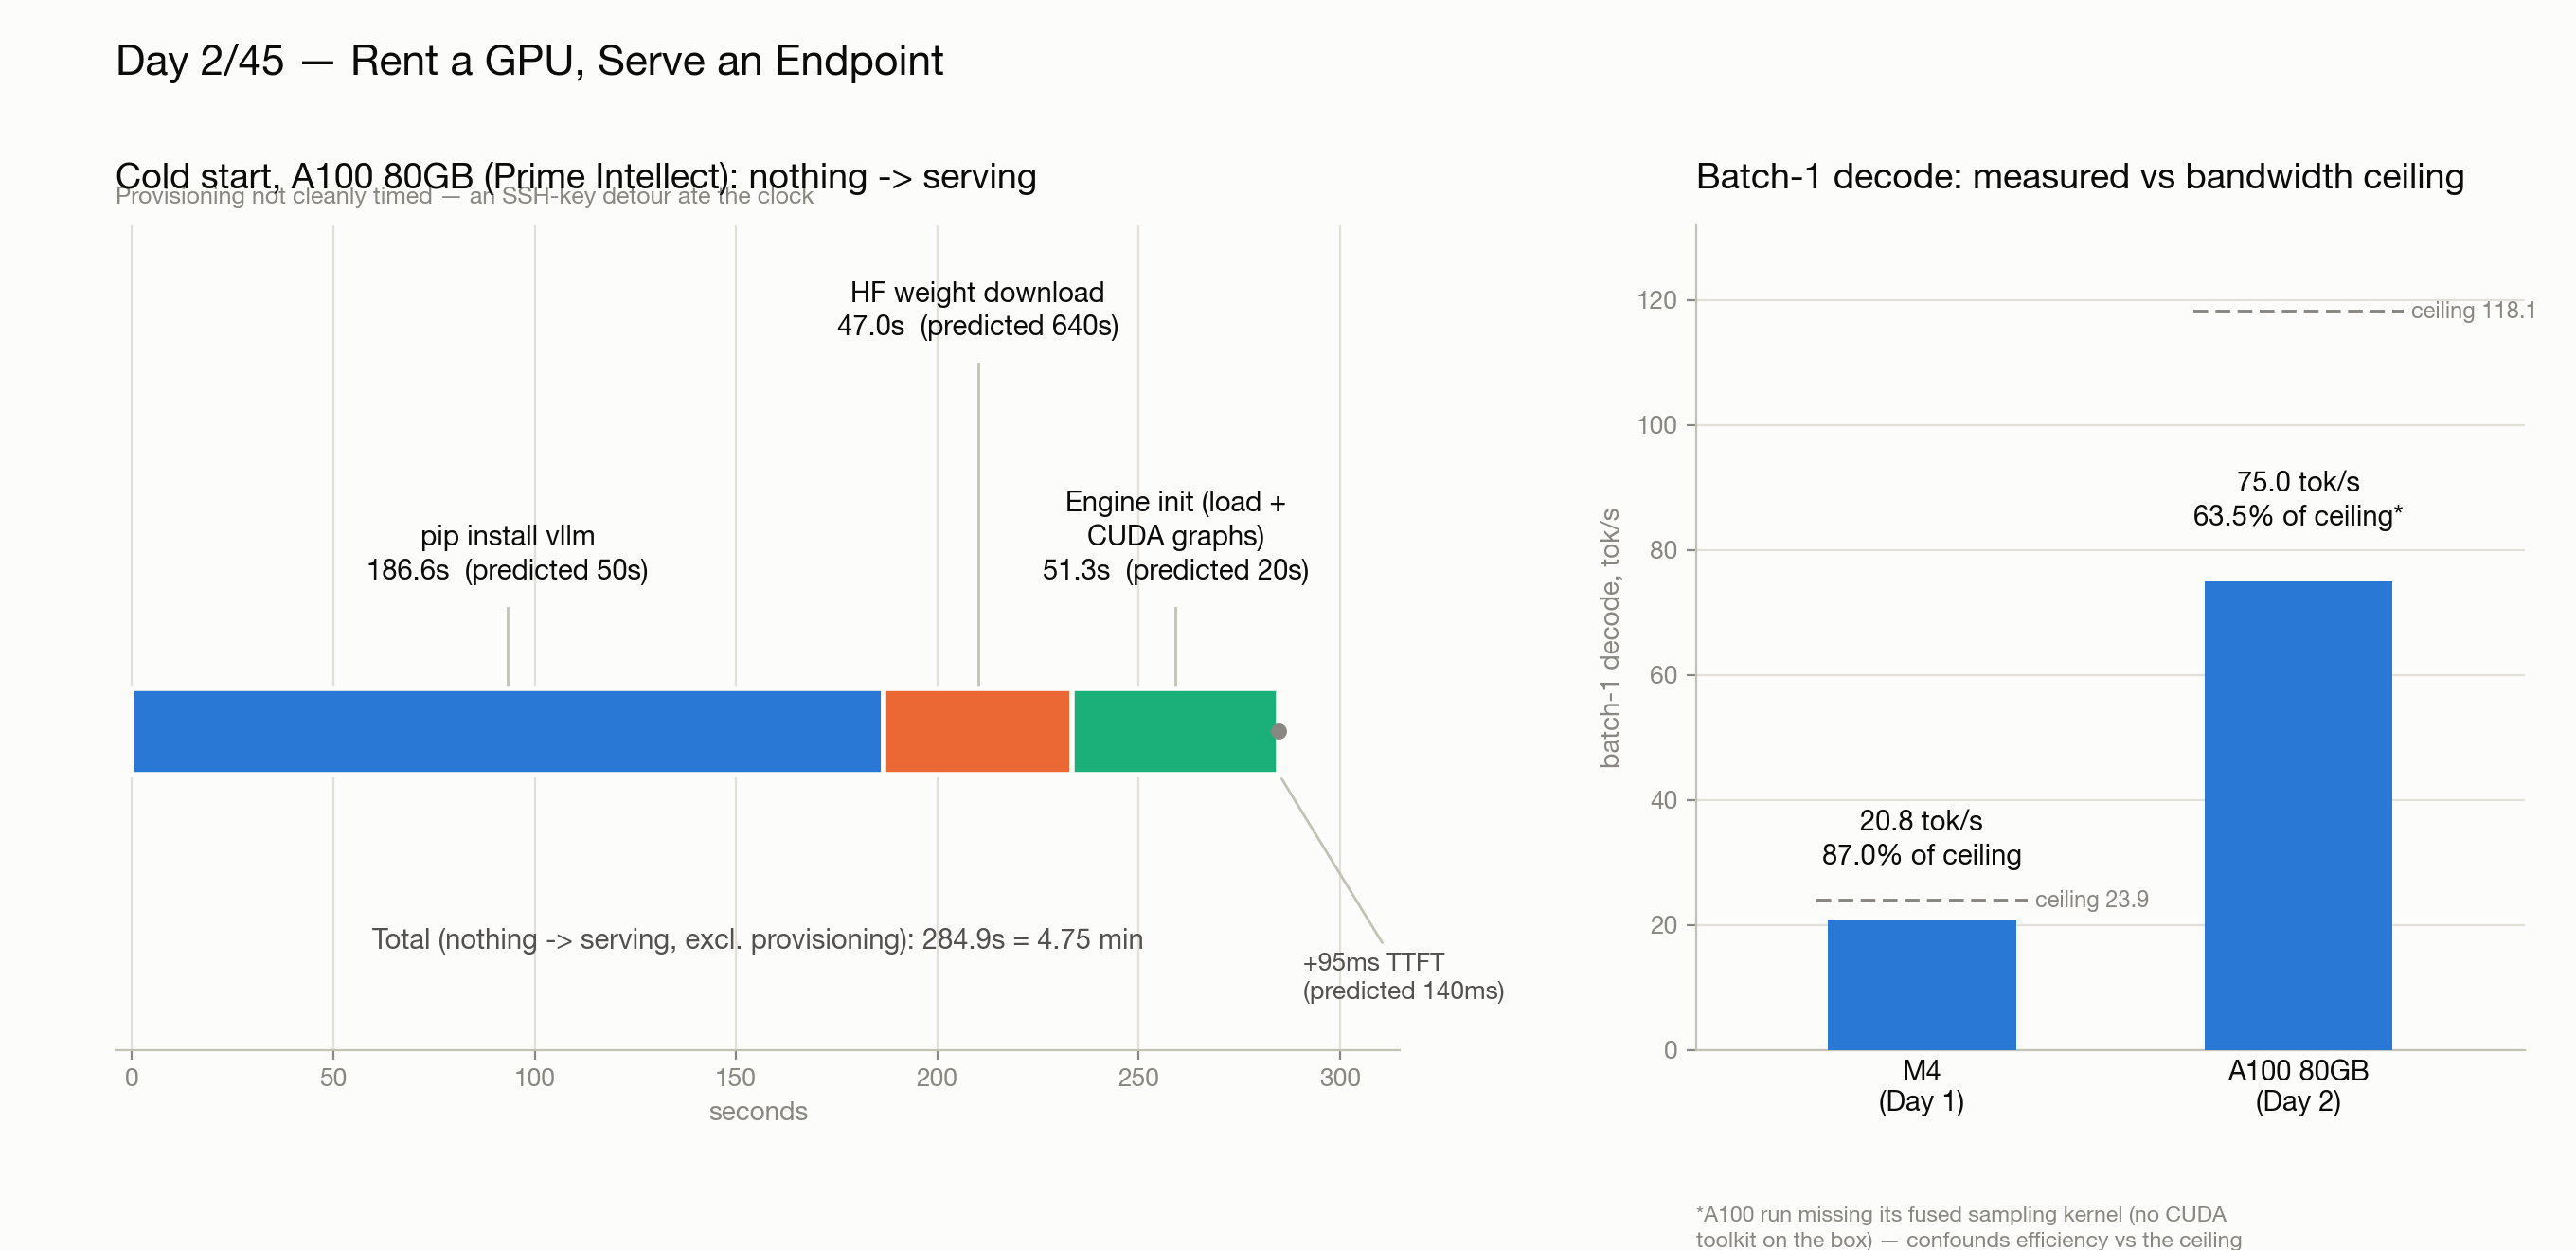
Four misses, four different mechanisms — that’s the actual finding. Not one wrong intuition repeated, but four distinct failure modes:
- pip install — heavy CUDA/PyTorch dependency trees are bigger than “a pip install” sounds like.
user+systime (161.7s) was still less thanreal(186.6s) — the ~25s gap was I/O wait, not CPU, a small preview of “not all wall-clock time is compute.” - HF download — the single biggest miss, in the safe direction (overestimated 13.6×), and the most instructive. The speedtest used one TCP stream to an unrelated public test server (thinkbroadband, UK). The real download used Hugging Face’s Xet backend — content-addressed chunks fetched in parallel from a well-peered CDN. A single-stream benchmark to the wrong server told us almost nothing about the path that mattered. This is Day 1’s “achievable bandwidth depends on who’s asking” lesson wearing a networking costume.
- Engine init — underestimated. Unlike the roofline numbers, there’s no closed-form formula for CUDA graph capture + kernel warmup time; it’s a software/engineering cost (how many batch-size buckets get captured, how the warmup loop is written), not a physical one. Worth remembering: some cold-start stages are physics, some are pure engineering overhead, and only the first kind is derivable from a datasheet.
- TTFT — right about the mechanism (dominated by tunnel/network round-trip, not compute), wrong about the magnitude. Both the prefill (~20 tokens ÷ ~19,000 ceiling ≈ 1ms) and one decode step (~8.5ms) are single-digit milliseconds — the other ~85ms was pure network.
The efficiency number has an asterisk, and the asterisk is real content. This box shipped with an NVIDIA driver but no CUDA toolkit — no nvcc. vLLM’s fastest sampling path (a fused FlashInfer kernel) tries to JIT-compile on first use; without a compiler, the engine crashed outright the first time. The fix (VLLM_USE_FLASHINFER_SAMPLER=0) unblocked serving but forces a slower fallback sampler for every single decode step — so part of the 63.5% (vs. the Mac’s 87%) is a genuine environment gap, not a clean statement about A100-vs-M4 hardware efficiency. Chased the “proper” fix afterward: installed the matching CUDA 13.0 toolkit (confirmed against torch.version.cuda), fought a PATH conflict with Ubuntu’s own pre-baked (and mismatched) nvidia-cuda-toolkit, got nvcc itself working — and then hit a third wall, nvcc fatal: Failed to preprocess host compiler properties, likely a /tmp noexec-class container restriction. Called it there rather than burn the rest of the session on infra. A confounded number with a clearly-explained cause is better content than a clean one — “here’s what an infra gap actually costs in tok/s” is a real, tellable story.
Caveats collected along the way
- Driver ≠ toolkit.
nvidia-smireporting “CUDA Version: 13.0” only tells you the driver’s max-supported version — it says nothing about whethernvcc(the compiler) is even installed. Cloud GPU images often ship only the former. - TFLOPS is 10¹², not 10⁹ — dividing raw FLOPS by GFLOPs/token without matching powers of ten silently produces an answer ~1000× too small. Always convert to the same order of magnitude before dividing.
- “Sparsity” numbers on a datasheet are conditional. NVIDIA lists dense vs. 2:4-structured-sparsity throughput; the sparse number only applies to weights actually pruned into that pattern via NVIDIA’s toolkit. A stock checkpoint is fully dense — use the dense number.
real/user/sysfromtimemean different things.real= wall clock (what a user waits);user= CPU time in your own code;sys= CPU time in the kernel on your behalf.user+sys < realmeans time was spent waiting (I/O), not computing.- A generic speedtest measures the wrong path. Testing bandwidth to an unrelated server (even a reputable one) doesn’t predict throughput to the server you actually care about — different peering, different protocol (HF’s chunked/parallel Xet fetch vs. a plain single-stream GET). Test the actual mechanism when you can.
nvidia-smishowing ~90% VRAM used isn’t a leak. vLLM’s PagedAttention pre-allocates most of VRAM as its KV-cache block pool at startup — a deliberate reservation, not a runaway process. (Confirmed idle baseline at a clean 0 MiB before vLLM ever launched; didn’t get to capture the “looks full” moment live this session — queued for Day 3.)- SSH host-key warnings on a fresh cloud instance are usually IP reuse, not a real MITM. Every new VM gets a fresh host key; providers commonly recycle IPs across ephemeral instances.
ssh-keygen -R <ip>and reconnect — but actually look at why the key changed before assuming it’s benign. - Non-default SSH keys need
-i(or a config entry) — they aren’t tried automatically. OpenSSH only auto-offers a fixed set of default-named identity files in~/.ssh/; a differently-named or differently-located key (e.g. a marketplace-provided keypair) is silently never offered unless pointed to explicitly.
Cold-start stage breakdown
The waterfall (chart above, left panel): pip install (186.6s) → weight download (47.0s) → engine init (51.3s) → +95ms TTFT. Total, nothing → serving: 284.9s ≈ 4.75 minutes — excluding provisioning, whose clean timestamp got lost in an SSH-key detour (own the miss: this is exactly the “measurement hygiene” lesson from Day 1, just applied to logistics instead of a benchmark).
Every one of these stages is something production serving infra spends real engineering effort eliminating: baked container images skip the pip install, pre-staged weights on fast storage (or literal memory snapshotting) skip the download, warm pools skip engine init entirely. Today’s cold start is the bill that always-on or aggressively-optimized serverless infra pays to make invisible.
Left on the table (deferred to Day 3)
- One
watch nvidia-smiwhile generating: note how much of the 80GB is KV cache pre-allocation, not weights — vLLM grabs ~90% by default. Session confirmed the mechanism verbally (idle baseline was a clean 0 MiB before vLLM ever ran) but never captured the “looks full” moment live. Easy quick win for Day 3’s opener. - Hit the endpoint with 4 concurrent requests — does per-request tok/s drop 4x? (It shouldn’t. That gap is Day 3’s whole story — deliberately deferred, not skipped.)
- Skim the vLLM startup log line by line — it narrates the whole Serving Models stack: config → weights → graphs → scheduler → server.
X post — final draft (Alex’s, published)
Day 2/45 of Inference Engineering: Renting a GPU & Serving an Endpoint 🖥️
Today, I rented a A100 [80GB, PCIe] (@PrimeIntellect, $1.20/hr), and used vLLM to serve Qwen3-8B at bf16.
I’ve previously found cloud compute annoying to boot up (looking at you AWS console 😑), so this was surprisingly simple.
Very quickly I ran into a cold-start problem. Since I was on a fresh Ubuntu image, I needed to install vLLM (~189s), download the weights from Hugging Face (~47s), and then initialize the engine (~51.3s). So ~5m—not including me fumbling around.
Initializing the engine includes loading the 16.4GB of weights off disk into VRAM (fast, not the bottleneck), and CUDA graph capture, where vLLM runs warmup passes and pre-records the entire kernel launch sequence so it doesn’t pay per-kernel launch overhead on every single token later.
If you’re serving inference at scale, booting wastes precious compute time that could be used to serve customers, so there’s a whole industry of optimizations: baking a container image with everything pre-installed, pre-staging weights on fast storage instead of pulling from HF cold, keeping a pool of already-initialized workers around, or, most aggressively, snapshotting a fully-loaded process’s memory and restoring it.
Reminds me of the throughput work I got to do at AWS!
Moving on, I used the memory bandwidth to predict the decode speed:
1,935 GB/s (A100, PCIe) ÷ 16.4GB (weights) = ~118 tok/s
I measured 75 tok/s, so 63.6% of the ceiling, much less efficient than my Mac at 87% 😕. This is likely because this box’s driver didn’t ship the CUDA compiler vLLM needed, so I had to fall back to a slower sampling path.
Speaking of surprises 👀: nvidia-smi showed this 16GB model using ~75GB of the card’s 80GB VRAM. Only ~15GB of that is actual weights; the rest is vLLM’s KV cache pool, pre-allocated upfront by default (it grabs ~90% of free VRAM whether you need it yet or not, so future requests can be served without stalling on memory allocation). Pretty cool.
vLLM comes with an OpenAI compatible REST schema, and had some other dials. To test TTFT (Time-to-First-Token) I streamed a short completion through an SSH tunnel from my laptop to the pod (this box was SSH-only, no exposed HTTP port) and measured 95ms ⚡, almost entirely from the network latency!
Tomorrow I’ll explain continuous batching and test it out. Stay tuned 😎
[attach: xdoi-day2-coldstart-decode.png, nvidia-smi screenshot]
What surprised me — candidates
- The A100 being less batch-1-efficient than the M4 — the “bigger hardware should just win” intuition failing in a derivable, not folklore, way (the 161x vs 11x compute/bandwidth ratio).
- The download prediction missing by 13.6x in the safe direction — proof that a speedtest to the wrong server is worse than no speedtest, because it’s confidently wrong.
- Losing a clean provisioning timestamp to an SSH-key mistake — the plumbing’s own version of Day 1’s “measurement hygiene” lesson.
- Chasing the fused-sampler fix three layers deep (missing nvcc → toolkit PATH conflict → host-compiler/tmp issue) and calling it — deciding when a confound is good enough content vs. worth fully resolving.
- Four cold-start misses, four unrelated causes (dependency weight, wrong benchmark proxy, no-formula software cost, network-dominated latency) — nothing here was “the same mistake twice.”