Day 3 — Benchmark the Endpoint
Unit from Arc 1 of Curriculum. Follows Day 2 — Rent a GPU, Serve an Endpoint. Pair with a skim of Orca (OSDI ‘22) — iteration-level scheduling is the mechanism being measured today.
The question: batch-1 decode is a waste of an A100 — every token reads all 16.38 GB of weights to do ~16.4 GFLOPs, an arithmetic intensity of ~1 FLOP/byte on a card whose ridge point is ~161. Continuous batching amortizes the weight read across concurrent requests. Can the roofline predict the knee — the concurrency where the GPU stops being memory-bound — before the sweep runs?
Day 2 was plumbing with one number at the end. Today is five predictions, each derived from chip specs and the model config before touching the box. The sweep only gets run after every blank below is filled in ink.
The mechanism (~30 min, before the math)
Serving Models has one line on this (“requests join/leave every token step, up to ~23x vs static”) — today that claim gets a mechanism and a measurement. Skim Orca (OSDI ‘22) §1–3 plus the Anyscale continuous-batching post, then answer these in my own words at the top of the Measurements section:
- Static batching’s two wastes. A static batch is admitted together and released together, padded to the longest sequence. Name both costs: the padding FLOPs, and the head-of-line blocking where a 20-token completion holds its slot while a 2,000-token neighbor finishes. Which one does Arc 2.5 measure directly?
- Orca’s two ideas, separately. (1) Iteration-level scheduling: the schedulable unit is one decode step, not one request — finished sequences exit and queued ones enter between any two steps. (2) Selective batching: the matmuls (QKV/MLP projections) batch fine across ragged sequences because they’re per-token, but attention can’t — different KV lengths per sequence — so it runs per-sequence while everything else batches. Which of the two does vLLM keep, and what did PagedAttention replace?
- Why decode makes this possible at all. Every request needs the identical weight pass every step, so a decode step is a natural synchronization point and batching = amortizing the one weight read — this is the same fact as the arithmetic-intensity ≈ B claim in the math below. If that isn’t obviously the same fact, stop and make it obvious.
- What admission actually costs. When the scheduler admits a new request mid-flight, its prefill has to run somewhere — either stalling decode iterations (TTFT for it, TPOT spike for everyone else) or chunked in alongside them. That tension is prediction 5, and the
/metricsscrape should show it.
Reading notes — Orca (OSDI ‘22)
ORCA: A Distributed Serving System for Transformer-Based Generative Models
Transformers are auto-regressive, so the output is fed into the input of the next iteration. The iterations end when the transformer hits its max token cap or an end-of-sequence special token.
Naively just batch the requests together and return together. The issue is that if one of the requests in the batch finishes before others, this naive approach doesn’t let you return that request until the entire batch of requests finishes — its latency increases unnecessarily.
Similarly, if a new request comes in, it must wait till the batch is finished entirely. This means that batches of requests require an entirely new instance of the model.
The solution is iteration-level scheduling. The scheduler selects which requests get executed at what point and manages a “request pool”.
Unfortunately, we can’t coalesce tensors of different shapes. We also can’t batch the attention operation for requests of different lengths.
You could pad and mask, but then you pay non-insignificant FLOPs. If you batch a 1000-token pre-fill with a 10-token pre-fill, then you do 1000 × 2 work instead of 1010.
In addition, the attention op requires you to look back at the prefixed sequence — (notes trail off here; selective batching is the answer: flatten every token from every request into one [Σ tokens, hidden] tensor for the matmuls, split/merge per-sequence for attention — carried into the post draft below.)
Arc 2.5/2.6 (padding-waste measurement, Rust batching simulator) build this from scratch later; today is concept + live measurement.
Debts from Day 2 (do first)
- Check what Prime Intellect actually offers for volume/image persistence — researched 2026-07-31:
- No pause/stop-resume. Pod lifecycle is create → delete, nothing in between. The only “warm” option is leaving the pod running ($1.20/hr).
- Persistent network disks exist (Storage tab → Create Disk): survive pod termination, attach at pod provisioning (“Add Shared Filesystem” button), billed continuously whether attached or not (~0.36/day). Catch: disk is locked to one provider + datacenter (docs mention Hyperstack, RunPod), so it anchors future rentals to wherever it lives — bad fit with on-demand availability roulette (Day 2: planned 4090, got A100).
- Custom VM images exist but are API-only (build a VM image from a linux/amd64 container image, needs “VM sandboxes” enabled; undocumented size limits/pricing) — too much machinery for this project.
- Verdict for Day 4+: skip persistence. Day 2’s measured cold start was ~285 s and the big items (pip 187 s, HF download 47 s) aren’t worth a datacenter anchor to save. Instead, at pod creation check whether an image with CUDA toolkit preinstalled is offered (fixes the fused-sampler debt at the source); fallback is the Day 2 apt toolchain fix with
TMPDIRpointed somewhere exec-able before runningnvcc.
- Get a box/image with a working CUDA toolkit so FlashInfer’s fused sampler JITs (
nvcc --versionbefore anything else; grep the vLLM startup log to confirm the fused path). This removes Day 2’s 63.5%-of-ceiling asterisk - Re-measure clean batch-1 decode: predict ___ tok/s (Day 1 hit 87% of ceiling on the Mac; ceiling here is 118.12)
-
nvidia-smibefore and aftervllm serve— capture the “80 GB looks full at idle” moment. That’s KV pre-allocation, not weights; the block math below says exactly how much
The math (fill in predictions BEFORE running)
Inputs, all public or from Day 2: A100 80GB PCIe 1,935 GB/s HBM, 312 TFLOPS dense bf16. Qwen3-8B: P ≈ 8.2B params, 16.38 GB bf16 weights, 36 layers × 8 KV heads × 128 head dim → 147 KB/token of KV in bf16 (the Day 1 formula, same chips different bus).
1. The knee, from the roofline. One decode step at batch B: compute ≈ B × 2P FLOPs; weight traffic = 2P bytes, read once and shared across the batch. So arithmetic intensity ≈ B FLOPs/byte (KV ignored for now). Ridge point = 312e12 ÷ 1,935e9 ≈ 161 FLOPs/byte.
- Naive predicted knee B* (intensity = ridge): ___
- Now add KV: each request also streams its own cache every step — kv_bytes(B, ctx) = B × ctx × 147 KB. At 1k context, per-step traffic = 16.38 GB + B × 0.147 GB. Intensity(B) = 2PB ÷ (2P·2bytes + B·ctx·147KB)… solve for where it crosses 161, or note that it asymptotes below the ridge and the “knee” is really a flattening: revised B* ≈ ___
- Sanity: what does vLLM’s default
max_num_seqscap the running batch at, and does it bind before B*? ___
2. Three points on the predicted throughput curve. Re-anchored 2026-07-31: the box is A100-SXM4 (2,039 GB/s), not PCIe. Closed form (1k ctx): f(B) = 2,039·B ÷ (16.38 + 0.147·B) aggregate tok/s — a saturation curve with half-max at B = 16.38/0.147 ≈ 111 (same fact as the 112 FLOPs/byte intensity asymptote) and asymptote 2,039/0.147 ≈ 13,870 tok/s, below the ~19,000 compute roof → no knee at 1k ctx, only flattening. In ink:
- B=1: 123.4 tok/s (reproduces the 124.5 ceiling minus its own KV)
- B=16: 1,742 tok/s
- B=64: 5,060 tok/s aggregate, per-request = 79.1 (the graceful-degradation number: 63 neighbors cost each user ~36% of solo speed)
- B=128: 7,415 aggregate / 57.9 per user (past half-saturation, the flattening should be visible)
3. KV block accounting, predicted from memory. vLLM takes gpu_memory_utilization (default 0.9) of 80 GB → ~72 GB budget; subtract 16.38 GB weights and ~a few GB activation/workspace → predicted KV pool ≈ ___ GB → ÷ 147 KB/token → ___ max cached tokens → ÷ block_size 16 → predicted num_gpu_blocks ≈ ___. The startup log prints the real number; target within ±10%.
- Corollary: max concurrent 1k-token-context requests before preemption ≈ cached tokens ÷ ~2k (1k prompt + 1k gen) = ___
4. Little’s law cross-check. L = λW: concurrency ≈ throughput (req/s) × mean request latency (s). This must hold at every sweep point in a closed-loop load generator — if it doesn’t, I’m misreading what vllm bench serve holds constant (closed-loop fixed concurrency vs open-loop fixed arrival rate are different queueing systems; know which one is running). Networking day job, finally admissible.
5. TTFT under load. Prediction: TTFT stays near-flat while the scheduler admits prefills immediately, then p99 blows up once requests queue (running batch or KV blocks exhausted, or prefills serialize behind decode iterations). Predicted concurrency where p99 TTFT > 2× p50: ___
Steps
- Resurrect endpoint; confirm fused sampler; capture startup log — pull
num_gpu_blocks,max_num_seqs, KV pool size → score prediction 3 - Clean batch-1 baseline → score the Day 2 debt
- Sweep concurrency 1, 2, 4, 8, 16, 32, 64, 128 with
vllm bench serve(genai-perf as fallback), fixed ~1k in / ~1k out, ≥3 min per point. Record: aggregate tok/s, per-request tok/s, TTFT p50/p99, TPOT (time per output token) p50/p99 - Scrape
/metricsduring the sweep —vllm:num_requests_running,num_requests_waiting,gpu_cache_usage_perc, preemption counters. The knee should be visible server-side (waiting > 0, cache % pinned) before it’s visible client-side; catching that ordering is the learning - Chart 1: aggregate throughput vs concurrency, predicted curve from prediction 2 overlaid, both knees marked
- Chart 2: TTFT p50/p99 vs concurrency — the latency price of the throughput
- Little’s law check at every point (a one-line calc per row)
- Goodput row: max throughput subject to TTFT < 500 ms and TPOT < 50 ms — the SLO-constrained number a provider could actually sell (DistServe’s framing). Compare it to raw max throughput; the gap is the marketing
Measurements
Run 2026-07-31 (Day 4 session), A100-SXM4-80GB, vLLM 0.26.0, fused sampler active, vllm bench serve closed-loop, 1k in / 1k out, ignore_eos, temp 0.8 / top_p 0.95 / top_k 20, num_prompts = 10×C. Raw JSONs: sweep_c{1..128}.json.
| Concurrency | Agg tok/s | Per-req tok/s | TTFT p50/p99 (ms) | TPOT p50/p99 (ms) | Running/waiting | KV cache % | Little’s law ✓? |
|---|---|---|---|---|---|---|---|
| 1 | 88.8 | 88.8 | 23*/26 | 11.25/11.27 | not captured | — | ✓ 1.00 |
| 2 | 175.2 | 87.6 | 59/138 | 11.34/11.41 | — | — | ✓ 2.00 |
| 4 | 339.7 | 84.9 | 69/201 | 11.67/11.81 | — | — | ✓ 3.99 |
| 8 | 639.5 | 79.9 | 75/263 | 12.40/12.66 | — | — | ✓ 7.97 |
| 16 | 1,139.6 | 71.2 | 93/546 | 13.78/14.40 | — | — | ✓ 16.0 |
| 32 | 1,763.3 | 55.1 | 140/1,018 | 17.68/18.91 | — | — | ✓ 32.0 |
| 64 | 2,504.6 | 39.1 | 519/3,730 | 25.09/25.44 | — | — | ✓ 64.0 |
| 128 | 3,088.2 | 24.1 | 678/8,302 | 41.00/41.30 | — | — | ✓ 127.9 |
* c=1 TTFT (23 ms) is below the 53 ms compute floor for a 1k-token prefill → prefix-cache hit: bench random dataset reuses a fixed seed, so every point’s prompt set is a superset of the previous point’s. Post-hoc log audit (hit-rate column): C=2–32 ran at 50–66% cache hits (mid-curve throughput flattered, true gaps wider), C=64 drained 45→16% (evictions), C=128 clean at 0.2–0.5% — its TPOT 41.0 vs 21.9 modeled = 1.9× is the uncontaminated anchor. p99 ITL at 64/128 (148/196 ms vs ~25/41 median): decode stalling while whole 1k prefills pack into mixed steps (nothing chunks — 1k < the 8k budget; 148–196 ms ≈ 1–2k prefill tokens/step at realistic MFU) — Sarathi’s problem, observed directly. Next sweep: per-point --seed or disable prefix caching.
- Predicted knee: none at 1k ctx (flattening only, half-sat B≈111) · Measured: consistent — no plateau through C=128, agg still rising (3,088 at 128, per-req down to 24.1). But absolute levels miss big: measured is 65% of model at C=16, 59% at C=64, 53% at C=128. Cause, decomposed at C=64: measured step 24.9 ms vs modeled 15.0 ms — the model is decode-only, but half the workload’s tokens are prefill, costing ~4–7 ms/step amortized, plus ~3 ms/step engine overhead that doesn’t amortize away. (Note: “total tok/s = 2× output” is true by construction, not evidence — the evidence is the TPOT gap at the cache-clean C=128 point, 41.0 vs 21.9 = 1.9×, and the log windows where prefill floods crash gen throughput 4,400→700.) The decode roofline that hit batch-1 within 6% misses batch-64+ by ~1.9× (cache-clean lower bound): serving ≠ decode.
- TTFT knee (p99 > 2×p50): predicted C≈4 via synchronized-wave collision arithmetic ((C−1)×53 ms vs 2×78 ms) · measured C=2 (138 vs 117 ms). Mechanism confirmed (no resource exhausted — KV never bound, no preemptions); threshold early partly because prefix-cache hits depressed p50. Closed-loop + fixed lengths + fixed seed ⇒ p99 TTFT here measures burst behavior, not capacity — open-loop rerun is the control.
- Predicted
num_gpu_blocks: 22,959 (= 367,346 tokens; used 0.9×80 decimal GB + 3 GB activation guess) · Log says: 410,240 tokens (= 25,640 blocks, 56.34 GiB pool) — 10.5% under, decomposed: GiB-vs-GB slip (card is 80 GiB = 85.9 GB) + activation reserve 7× too generous (vLLM profiles it empirically: ~0.4 GB actual). Cross-check: 56.34 GiB ÷ 410,240 = 147,456 B/token, the config.json derivation exactly ✓ - Clean batch-1 (2026-07-31, Day 4 session): 88.4 tok/s (4,000 tok ÷ 45.25 s client-side,
ignore_eos, top_p/top_k set so the fused path actually runs) = 71.0% of 124.5 — ceiling re-anchored: this box is A100-SXM4 (2,039 GB/s), not PCIe, so Day 2’s 118.12 doesn’t apply. Predicted 75% → 5.7% over. Day 2 got 63.5% with the crippled sampler; bandwidth-adjusted fused-sampler gain ≈ +12% (asterisk: Day 2’s 75.0 used the diluted window-log instrument). Remaining 29% gap = ~3.3 ms/step vLLM overhead vs 8.03 ms ideal — does it amortize at high batch? That’s the sweep’s question - Goodput (TTFT<500ms, TPOT<50ms): depends which percentile carries the SLO — p99: C=8 → 640 tok/s (C=16 misses, p99 TTFT 546); p50: C=32 → 1,763 tok/s (C=64 misses, p50 TTFT 519). Raw max: 3,088 at C=128. Gap: 1.75–4.8× — that gap is the marketing (DistServe framing). TPOT SLO never binds (max p99 41.3 ms); TTFT is the constraint everywhere.
- Post-draft prediction scored: draft promised “64 users → ~4,800 agg, ~75 each” · measured 2,505 agg, 39.1 each — the featured miss for the writeup.
If time remains
- 8k-context arm: rerun a mini-sweep at 8k context. KV traffic per step is 8×, so the model in prediction 2 says the curve flattens earlier — one chart that proves the KV term is real, not decorative
- Preemption hunt: push past the block budget from prediction 3’s corollary, watch the preemption counter tick, and note whether vLLM recomputes or swaps — feel what “KV cache pressure” actually does to a request
- Chunked prefill dial: toggle/tune
max_num_batched_tokens, re-check p99 TTFT at high concurrency — the Sarathi-Serve idea, felt before reading the paper (Arc 4.4) - Open vs closed loop: rerun one mid-level point in request-rate mode; same nominal load, different queue behavior — which one resembles production traffic?
Post draft (concept-only — sweep deferred to Day 4)
Day 3 pivoted: short on time, so the post covers the continuous-batching mechanism + roofline predictions only. The sweep below, the five predictions’ scoring, and the Day 2 debts all roll forward to Day 4. Mechanism reading (Orca §1–3, selective batching) done — notes in the chat/AI-conversation log.
Chart: 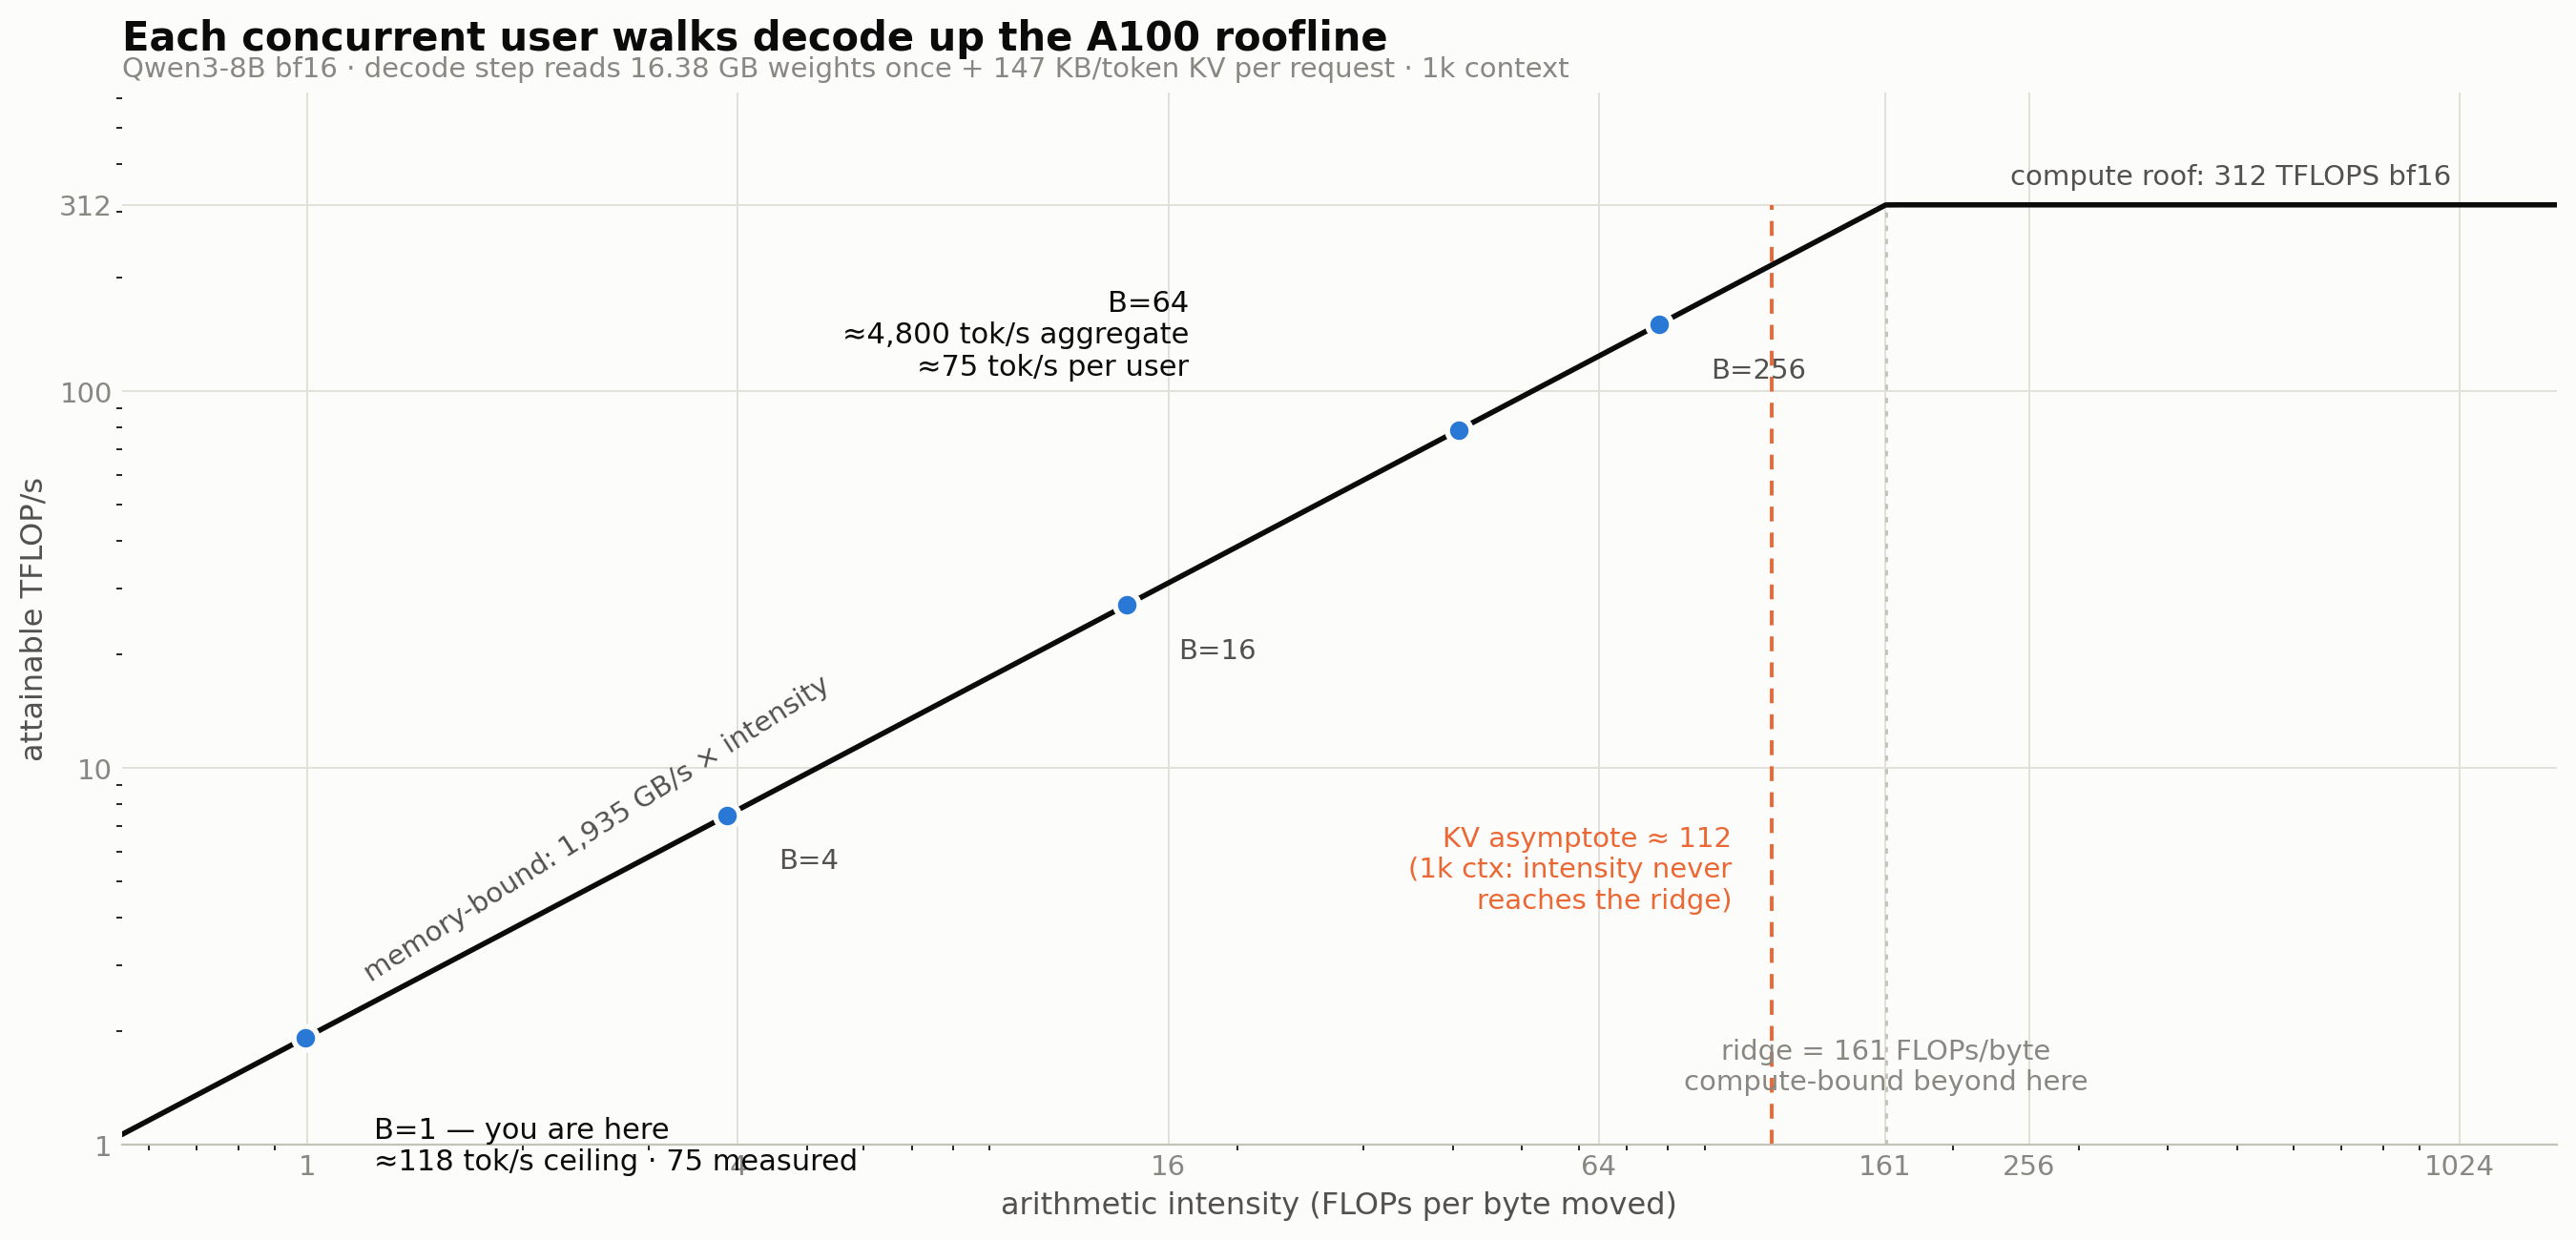
Day 3/45 of Inference Engineering: Continuous Batching
On Day 2 my rented A100 decoded 75 tok/s for a single user.
Every token reads all ~16 GB of weights to do ~16 GFLOPs. That’s an arithmetic intensity of ~1 FLOP/byte on a chip whose ridge is 161 FLOPs/byte (the intensity at which the chip switches from memory to compute-bound). So we are underutilizing our precious compute by 161x 😡!
The obvious fix is to batch requests together. But naive (static) batching means that:
(1) if one request finishes before the others, it can’t return early
(2) a new request can’t join mid-flightContinuous batching (Orca, OSDI ‘22) shrinks the schedulable unit from a request to a forward-pass. This circumvents (1) & (2) and lets you add/remove requests at-will.
Today, this is what vLLM and basically every serving engine does.
I had a busy day so I’ll benchmark tomorrow — prediction in ink first: the roofline says 64 users → ~4,800 tok/s aggregate, ~75 tok/s each. That’s every one of 64 users getting what my single user measured. (Ceiling math — Day 2 only hit 63.5% of ceiling at batch 1, so the real curve lands under it.)
🤓 notes for the technical crowd:
– A decode step of batch B reads the weights once but does B× the FLOPs, so arithmetic intensity ≈ B. Batching utilizes the chip more!
– Unfortunately, attention can’t batch across requests. Each query attends to its own KV cache, and cache lengths differ by construction because requests can join at different times. Normally this wouldn’t work. Orca’s “selective batching” flattens every token from every request into one [Σ tokens, hidden] tensor, then splits/merges them for the attention operation. Pretty neat.
– FYI vLLM later replaced the attention piece with PagedAttention.
– BUT, this means every request now drags its KV cache (147 KB/tok on Qwen3-8B) through memory every pass. At 1k context, intensity asymptotes at ~112 FLOPs/byte — below the ridge, so the card stays memory-bound at every batch size.
Prediction-2 math filled in while drafting (1k ctx, memory-bound model): B=1 → 117 tok/s · B=16 → 1,653 · B=64 → 4,802 agg / 75.0 per user · B=256 → 9,171 agg / 35.8 per user. KV-corrected intensity asymptote = 16.4 GFLOPs ÷ 0.147 GB ≈ 112 FLOPs/byte < 161 ridge → no knee at 1k ctx, only a flattening.
Post skeleton
- Hook: “One GPU serves 1 user at 118 tok/s — or 64 users at ___ tok/s each. The chip’s spec sheet predicted the crossover before I ran anything.”
- The chart: throughput vs concurrency, predicted curve overlaid, knee marked.
- The number: predicted vs measured knee, % error.
- What surprised me: ____
- Tomorrow: quantize the checkpoint myself — fp8 halves the bytes every decode step reads, and today’s roofline says exactly what that should buy at every batch size. Prediction before download, as always.