Day 4 Writeup — Serving is not decode
Polished narrative for the sweep executed from Day 3 — Benchmark the Endpoint (Unit 1.3, Curriculum). Follows Day 2 — Rent a GPU, Serve an Endpoint and the concept-only Day 3 (Orca notes + post now live in Day 3 — Benchmark the Endpoint). Day 4 ran Day 3’s deferred measurements plus Day 2’s debts; quantization moves to Day 5.
The claim, made in public yesterday: the roofline says 64 concurrent users should each get ~75 tok/s (≈4,800 aggregate), every one of them enjoying what a single user measured. What happened: 2,505 aggregate, 39.1 each. The decode roofline that predicted batch-1 within 6% missed batch-64 by 2×, and the miss has a name: serving is not decode. Half the tokens a real endpoint processes are prefill tokens, and the model never billed them.
Setup
- A100 80GB — SXM4 this time, not PCIe (Prime Intellect on-demand roulette handed over the better card): 2,039 GB/s HBM vs 1,935, so every Day 2/3 ceiling got re-anchored ×1.054 before predicting. 3.60.
- Qwen3-8B bf16 (16.38 GB exact), vLLM 0.26.0 / torch 2.11 (cu13.0) / flashinfer-python 0.6.14.
- Debt 2 died first. Bare Ubuntu → working JIT toolchain, verified in stages:
torch.version.cudaread before installing anything (it said 13.0 — Day 2’s instinct happened to be right today, for wheels that didn’t exist on Day 2), NVIDIA-repocuda-toolkit-13-0, a 10-line JIT smoke test before ever starting vLLM, and positive confirmation in the startup log:topk_topp_sampler.py:55] Using FlashInfer for top-p & top-k sampling.— the exact line read out of vLLM’s source beforehand, not a guess about what “success” prints.
The math
Closed-form throughput model (1k context), derived before the run:
f(B) = 2,039·B ÷ (16.38 + 0.147·B) aggregate tok/s
Numerator: a batched decode step emits B tokens per weight pass. Denominator: the shared 16.38 GB weight read plus each request’s private 0.147 GB of KV (147,456 B/token × 1k — the config.json arithmetic vLLM’s own log later confirmed to five digits: 56.34 GiB pool ÷ 410,240 tokens). It’s a saturation curve: half-max at B = 16.38/0.147 ≈ 111 (the ~112 FLOPs/byte intensity asymptote in different clothes), ceiling 13,870 tok/s, below the ~19,000 compute roof — so no knee at 1k ctx, only flattening. A refined variant used 1.5k average live context (requests grow 1k→2k while decoding).
Predictions vs measurements
Originals in ink in Day 3 — Benchmark the Endpoint:
| Quantity | Predicted | Measured | Verdict |
|---|---|---|---|
| KV pool | 367,346 tokens | 410,240 | ❌ 10.5% under — GiB-vs-GB slip (card is 80 GiB) + 3 GB activation guess vs ~0.4 GB actual (vLLM measures activations with a dummy pass, then hands every remaining byte to KV) |
| Clean batch-1 | 93.4 tok/s (75% of 124.5) | 88.4 = 71.0% | ✅ near-hit, 5.7% over. Day 2’s crippled-sampler 63.5% asterisk: removed. Bandwidth-adjusted fused-sampler gain ≈ +12% |
| Aggregate @ C=16 | 1,742 (1,638 refined) | 1,139.6 | ❌ ~1.5× over, and that’s a lower bound: 50–66% of this point’s prefills were free cache hits (see audit), so the measured number is flattered and the true gap is wider |
| Aggregate @ C=64 | 5,060 (4,273 refined) | 2,504.6 | ❌ 2.0× over (1.7× refined) — the featured miss. Also a lower bound: cache hit rate was still draining 45%→16% during this point, so it too got partial free-prefill help |
| TTFT knee (p99 > 2×p50) | C ≈ 4 (burst-collision arithmetic) | C = 2 | ❌ early, mechanism confirmed — nothing exhausted; synchronized closed-loop waves + prefix-cache-depressed p50 |
| Little’s law (λW = L) | should hold every point | holds at all 8 points, ≤1% closure | ✅ the data-trust certificate |
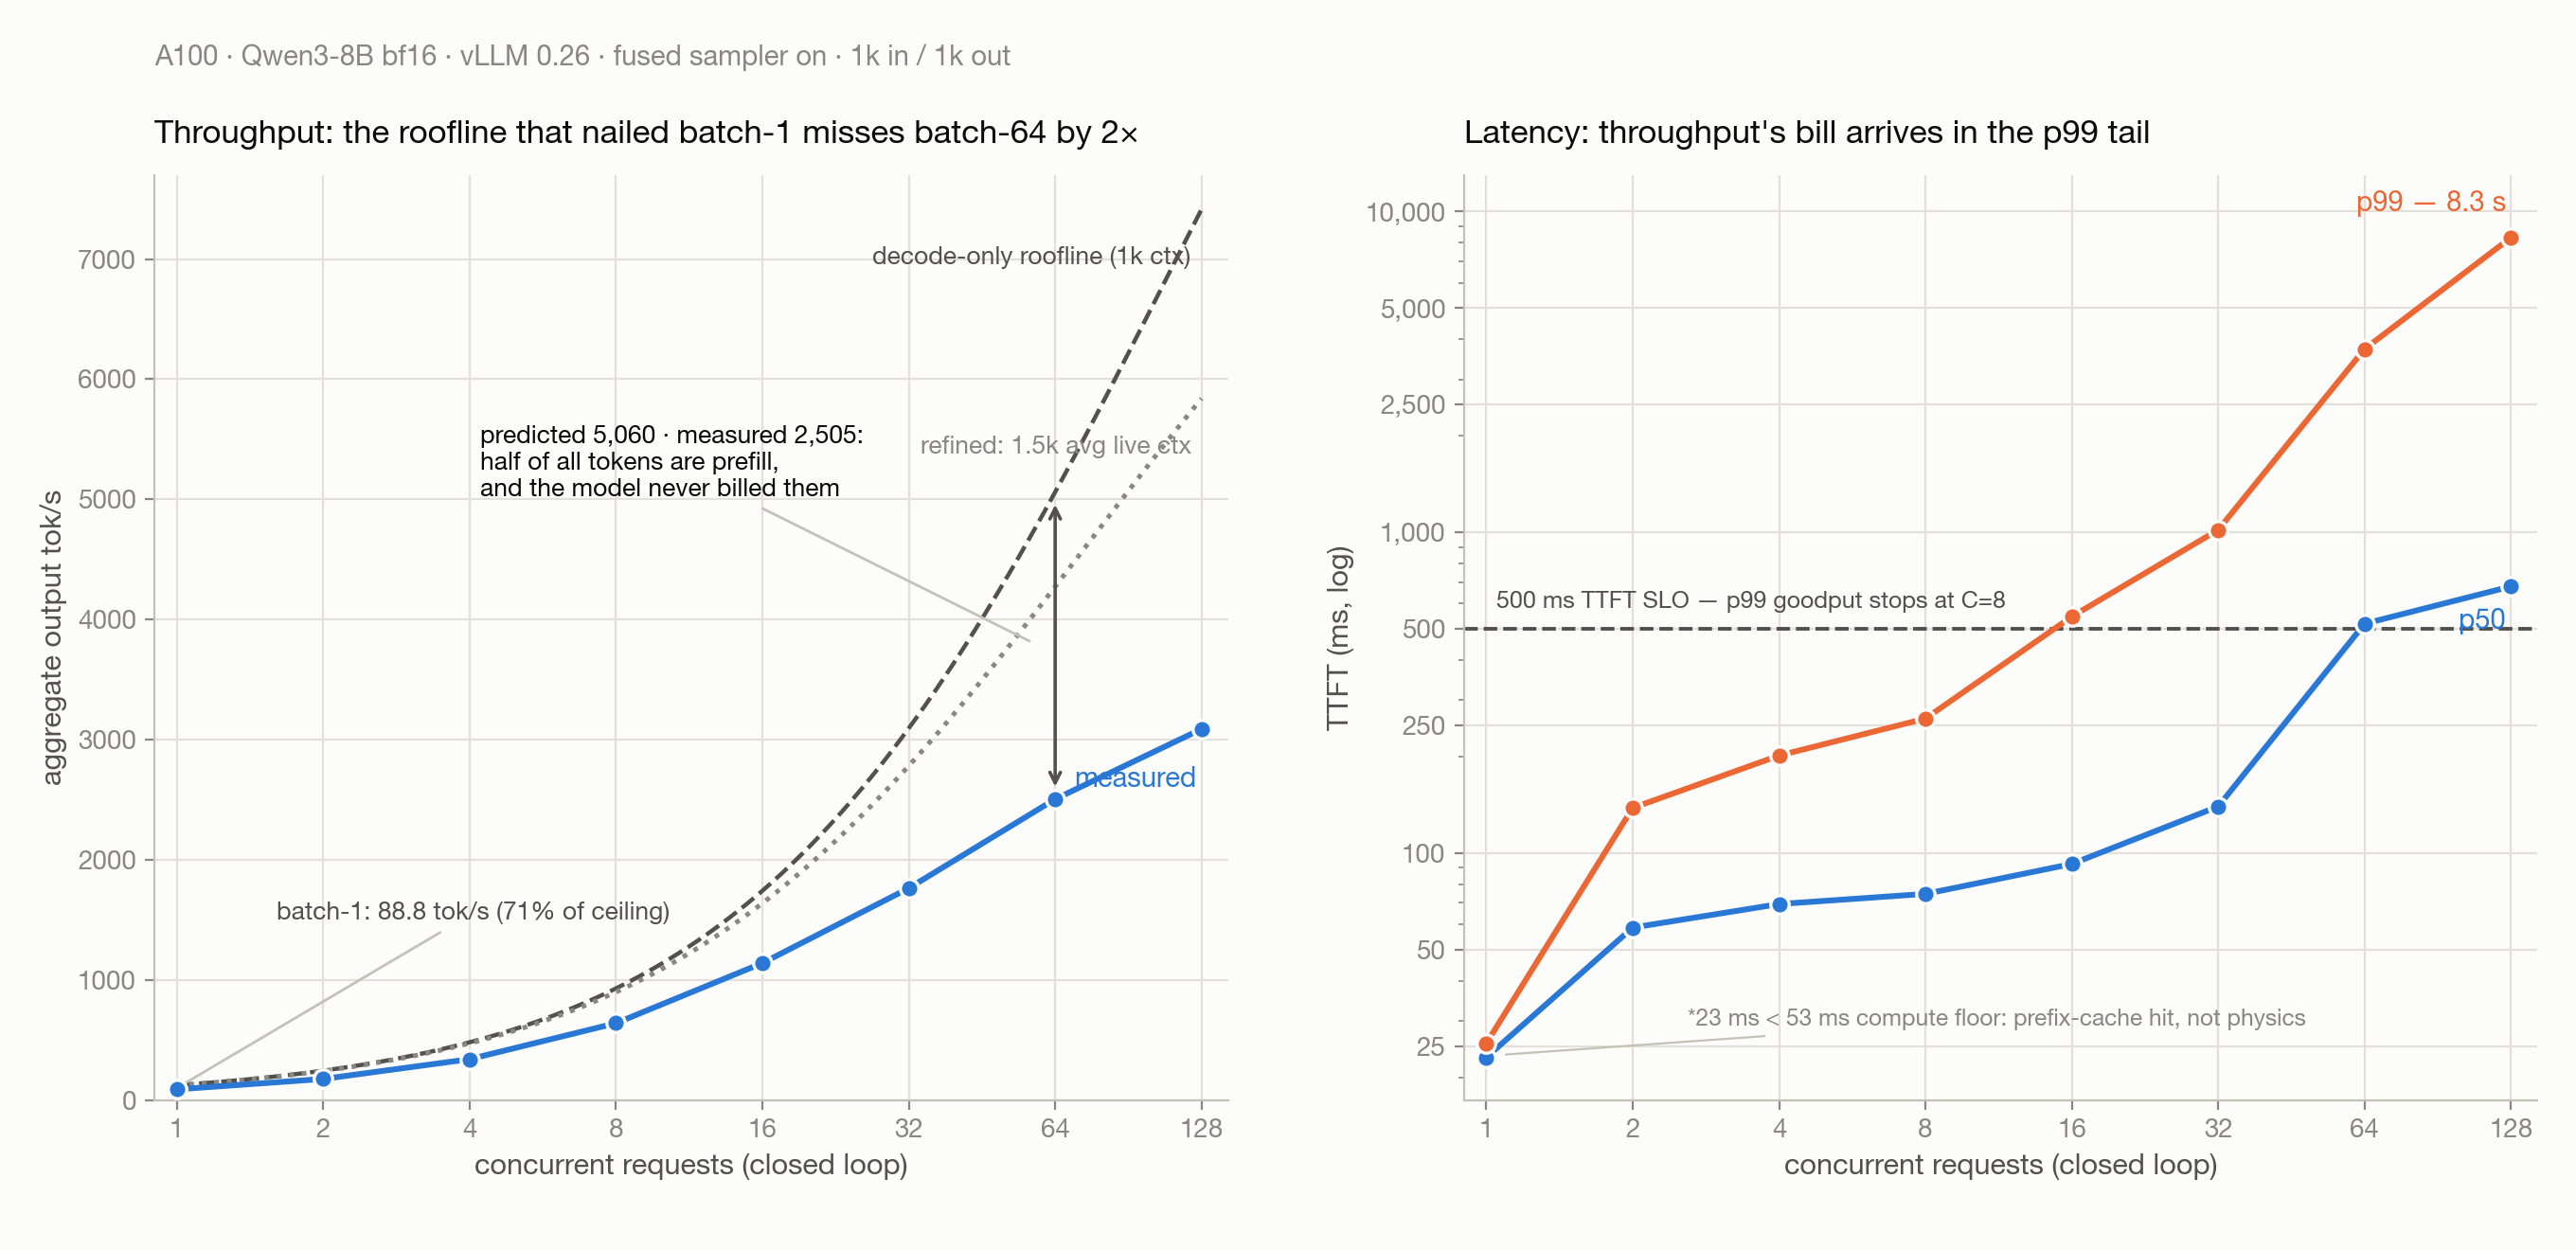
The finding: where the 2× went
The TPOT column locates the miss precisely. At C=64 the model says a decode step costs 15.0 ms; measured TPOT is 24.9 ms. The missing ~10 ms decomposes into:
- The prefill tax (~4–7 ms/step amortized at C=64; the dominant term at C=128). Every request brings 1,000 prompt tokens of pure compute the decode-bandwidth model never budgeted; an endpoint is half prefill by token count. (An earlier draft cited “total token throughput = 2× output” as the smoking gun — retracted on review: that ratio is true by construction, the bench counts prompt tokens at the tokenizer whether compute happened or not. The real evidence follows.)
- Per-step engine overhead (~3 ms/step). Already visible at batch 1 (11.3 ms measured vs 8.03 ms ideal = 71%); it does not amortize away by C=64.
The mechanism is visible raw in the server log at C=128: the 10s windows alternate between prompt ≈ 10,800 tok/s, gen crashed to 700–1,400 and prompt = 0, gen rebounded to 4,000–4,500 — decode throughput collapsing exactly when a wave of prefills occupies the steps. Same signature in the tails: p99 ITL 148/196 ms at C=64/128 vs ~25/41 ms medians. One packing detail matters (caught on review): with 1k prompts under vLLM’s ~8k max_num_batched_tokens budget, nothing is ever actually chunked — no single prefill needs splitting. The scheduler packs whole prefills into mixed steps, and 148–196 ms at realistic prefill MFU back-solves to ~1–2k prefill tokens per slow step, i.e., one or two whole prefills riding along. Prefill–decode interference is Sarathi-Serve’s problem statement (Arc 4.4) even when the chunking knob never engages.
Post-hoc audit: the prefix cache nearly ate the finding
Review question that had to be answered before trusting any of the above: the bench’s fixed seed means each sweep point’s prompt set is a superset of the previous point’s — were later points serving prefills from cache, making the “prefill tax” a tax nobody paid? The log’s hit-rate column answers per segment: validation run 0%; sweep C=1 climbing to ~50% (the validation run’s own prompts, re-generated); C=2–32 steady at 50–66% (each point re-running its predecessors’ prompts); C=64 draining 45%→16% (evictions — the ~410k-token pool holds only a few hundred cached prompts); C=128 at 0.2–0.5% — fully paid. Consequences, both directions: the mid-curve (C=2–32) was flattered — a half to two-thirds of its prefills were free, so the true model-vs-measured gap there is wider than charted — while C=128 stands clean: TPOT 41.0 ms vs 21.9 modeled, 1.9× with zero cache help. The 2× headline survives as a lower bound. Sweep hygiene for next time: a different --seed per point, or run benchmark servers with prefix caching disabled.
Goodput — the gap is the marketing
TPOT never breaks 50 ms (max p99: 41.3). TTFT is the binding SLO everywhere:
- p99 TTFT < 500 ms: last passing point C=8 → 640 tok/s goodput (optimistic; see caveat below)
- p50 TTFT < 500 ms: last passing point C=32 → 1,763 tok/s (same caveat)
- Raw max: 3,088 tok/s at C=128 (still climbing — consistent with “no knee, half-sat ≈111”)
Caveat: both SLO crossings sit inside the contaminated zone. C=8 and C=32 are squarely in the audit’s 50–66% cache-hit band, and TTFT is the metric prefix-cache hits distort most (a hit skips the prefill entirely, collapsing TTFT to scheduling latency). Cache-depressed TTFT percentiles push the SLO crossing to higher concurrency than a cold cache would allow, so 640 and 1,763 tok/s are upper bounds with an unknown optimism margin. The raw 3,088 at C=128 is the only clean number in this section. The citable goodput figure comes from the clean rerun (per-point seeds or prefix caching off), already queued alongside the open-loop control.
Raw-to-goodput gap: 1.75–4.8× depending on which percentile carries the promise — directionally robust (a clean rerun can only widen it), but the exact figures inherit the caveat above. DistServe’s framing, measured: the throughput number a provider brags about and the number they can sell under an SLO differ by the tail.
Caveats collected along the way
- A 23 ms TTFT for a 1,000-token prefill is physically impossible (compute floor ≈ 53 ms at 312 TFLOPS) — therefore it didn’t happen: vLLM’s prefix cache served it.
vllm bench serve --dataset-name randomuses a fixed seed, so the validation run and every sweep point generated overlapping prompt sets. The contamination went beyond TTFT: the hit-rate audit (see above) showed 50–66% of prefills served free at C=2–32, flattering mid-curve throughput, not just latency; only C=128 (0.3% hits, post-eviction) was fully clean. Impossible numbers are gifts twice over here — the 23 ms flagged the cache, and the cache audit nearly overturned the headline finding before the C=128 point saved it. Benchmark rule extracted: fixed-seed synthetic prompts + a prefix cache + one long-lived server = cross-point contamination by default. - vLLM’s periodic
Avg generation throughputlog is an operator heartbeat, not an instrument — it averages over wall-clock windows including idle time. A 1,000-token run “measured” 58.8 tok/s that way; the real number was 88.4. Day 2’s 75.0 carries the same asterisk in an unknown direction. Instruments, in ascending rigor: responseusage+ client clock →/metricscounters →vllm bench serve. - The fused sampler can be active and still not run. Startup selection ≠ per-request execution: requests with no top-k/top-p, or with a per-request
seed, silently take the native path (vLLM falls back per request). Benchmark requests must settop_p/top_kand must NOT setseed, or the “fused” run measures the fallback. gccpresent ≠ working C++ toolchain. This box’sgccresolved to gcc-12 while only g++-11 was installed; gcc is a driver that delegates tocc1plus(shipped in the matching g++ package), so nvcc died with the misleadingFailed to preprocess host compiler properties— the same top-level error as Day 2’s suspected /tmp-noexec wall, different cause. The check that actually discriminates:gcc -print-prog-name=cc1plus(a full path = fine; the bare name echoed back = missing). dpkg showingg++ iihides this: the package DB records what apt installed, not what PATH resolves.- Closed loop and open loop are different queueing systems.
--max-concurrencyfixes L (requests in flight, refills on completion — and with fixed lengths +ignore_eos, waves stay synchronized, so p99 TTFT measures burst collisions, not capacity);--request-ratefixes λ. Know which one is running before interpreting a percentile. Open-loop rerun queued as the control. - Rented “fresh” boxes are template clones, and templates carry debris: leftover CUDA 12.2
rcpackages, a root-owned~/.config(crashes vLLM’s telemetry thread harmlessly), a repointed gcc symlink. Nobody owns the intersection of Canonical + NVIDIA + provider image + previous builder — the renter is the integration engineer. Six seams to verify positively, in order: driver ≥ runtime, nvcc == torch’s CUDA (major), gcc within nvcc’s range, cc1plus matching gcc’s major, Python.h, ninja. huggingface-cliis gone (removed in huggingface_hub 1.0; thehfreplacement also balked here — unresolved, model download delegated to vLLM itself, which worked fine).- venv activation is per-shell, same category as PATH exports:
.bashrcpersists,activatedeliberately doesn’t. Every new SSH window needs it (or add it to.bashrc).
X post — draft (needs Alex’s voice pass)
Day 4/45 of Inference Engineering: The Concurrency Sweep 📉
Two days ago I published a prediction: 64 concurrent users on my rented A100 should EACH decode at ~75 tok/s (4,800 aggregate), because batched decode reads the weights once and shares the cost.
Today I ran the sweep (vLLM, Qwen3-8B, 1k in / 1k out, concurrency 1 to 128). Measured at 64 users: 2,505 aggregate, 39 tok/s each. My model was wrong by 2x.
Where the 2x went: my roofline modeled DECODE. But an endpoint doesn’t just decode. Every request also brings 1,000 prompt tokens of prefill, pure compute the bandwidth model never billed. You can watch it happen in the server log at 128 concurrent: the 10-second windows alternate between “prefill flood, decode crashes to ~700 tok/s” and “no prefill, decode rebounds to ~4,400”. p99 inter-token latency hit 196ms against a 41ms median. That’s decode stalling while whole prefills pack into the batch. (There’s a paper about fixing exactly this, Sarathi-Serve. I felt the problem before reading the solution.)
Plot twist during writeup review: vLLM’s prefix cache almost fooled me. My load generator reuses a fixed random seed, so each sweep point repeated earlier points’ prompts, and up to 66% of prefills were served from cache, free. The tell was a physically impossible number: a 23ms time-to-first-token on a prefill with a 53ms compute floor. If a number beats physics, it’s measuring something else. Luckily the 128-concurrent point had fully evicted the cache (0.3% hits) and paid for every prefill: still 1.9x below the model. The miss stands, as a lower bound.
The stuff that went right:
– Fixed the CUDA toolchain from Day 2, so vLLM’s fused FlashInfer sampler finally ran: clean batch-1 is 88.4 tok/s, 71% of ceiling (was 63.5% crippled)
– Predicted vLLM’s KV cache pool from config.json arithmetic: 147,456 bytes/token. The startup log agreed to five digits
– Little’s law (concurrency = throughput × latency) closed within 1% at all 8 sweep points. When a queueing identity holds, you can trust the load generatorTomorrow: quantization. fp8 halves the bytes every decode step reads, and today’s curve says exactly what that should buy at every batch size. Prediction in ink first, as always.
[attach: xdoi-day4-concurrency-sweep.png]
What surprised me — candidates
- The 2× miss itself — the same formula that was 94%-accurate at batch 1 being 50%-accurate at batch 64, with the error being conceptual (what a serving workload is), not arithmetic.
- An impossible number (23 ms TTFT < 53 ms physics floor) being the thing that exposed the prefix cache — the roofline as a fraud detector, not just a predictor.
- Little’s law closing at every point — queueing theory as a data-validity check, not just analysis.
- gcc existing but being unable to compile C++, and the error surfacing two layers up wearing nvcc’s clothes — the second time this curriculum a top-level error message named the wrong subsystem.
- vLLM reserving only ~0.4 GB for activations — it doesn’t guess, it measures, then bets everything else on KV.
- The p99-TTFT “knee” arriving at C=2, caused by the benchmark’s own synchronized waves rather than any exhausted resource — the load generator’s artifact showing up before the server’s limit.